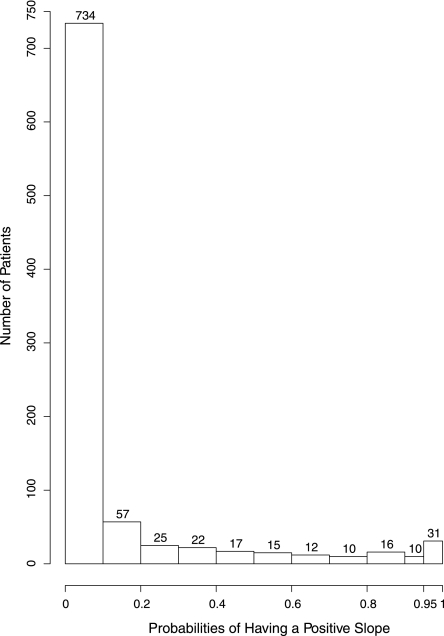
Figure 2.
Probabilities of having a positive slope (being an improver). This graph shows the histogram of probabilities of having a positive slope (being an improver) for all participants. The height of each vertical bar represents the number of participants in that category. There are 31 patients with P≥0.95, and 94 patients with P≥0.5.

