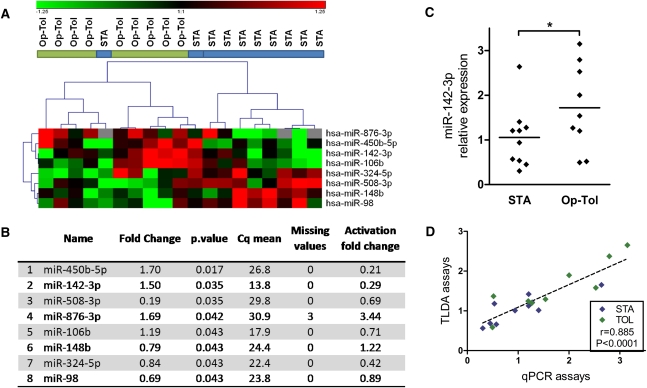
Figure 1.
Differential miRNA in PBMCs from operationally tolerant compared with STA kidney transplant recipients. (A) The eight top-ranked miRNAs according to Mann–Whitney tests are represented in this heat map, in which blue bars represent STA patients (n=10) and green bars represent operationally tolerant (n=10) patients. The heat map represents normalized and color-coded relative expression values (2−ΔΔCq), in which red values indicate overexpression and green values indicate underexpression. (B) The eight miRNA are classified according to their uncorrected P values, which were used only for ranking miRNA rather than for an absolute identification of differential miRNA. FCs of miRNA after PHA/IL-2 activation of PBMCs from healthy volunteers are displayed in last column. (C) Relative expression values of miR-142-3p from TLDA assays are displayed in a scatter plot. (D) Correlation between TLDA assays and individual Taqman qPCR assays for miR-142-3p (9 operationally tolerant and 10 STA patients).

