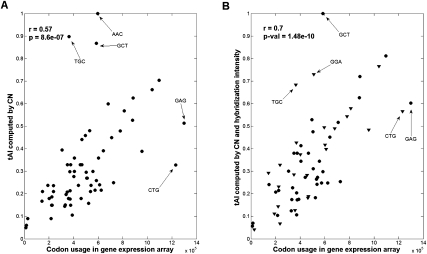
FIGURE 6.
Correlation of the tRNA measurements and the codon usage of MCF-10A cells. (A) The tAI value of each codon was computed using the genomic tRNA copy number of the tRNA genes. Recall that the calculation by the tAI covers all 62 codons. (B) The tAI values of each codon were computed using the normalized values from the hybridization intensity levels. The missing values are inferred based on the genomic tRNA copy number (triangles). Note that the overall correlation was significantly increased when the tAI was calculated based on a combination of the genomic tRNA copy number and the actual experimental data (based on the hybridization intensity from the 30 unique probes).

