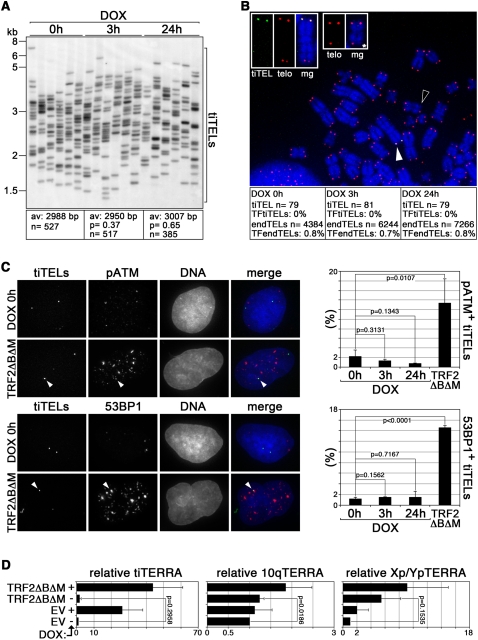
FIGURE 6.
Transcription induction does not compromise tiTEL stability. (A) STELA analysis of tiTEL length in cells treated as indicated. Average (av) telomere length is indicated together with the number (n) of tiTELs analyzed. Molecular weights are on the left in kilobases. (B) DNA FISH on metaphase chromosomes prepared from cl32 cells treated as indicated. TiTELs were identified with LacO PNA probes (in green), telomeric sequences (telo) were detected using telomeric PNA probes (in red). DAPI-stained DNA is in blue. The white and black arrowheads point to the tiTEL enlarged at the top (three left panels) and to an example of telomere free end (*) enlarged at the top (two right panels), respectively. Single channels and merged (mg) channels are shown. The fraction of telomere-free tiTELs (TFtiTELs), and endogenous telomere-free ends (TFendTELs) are indicated. Experiments were performed in duplicate and the cumulative number of analyzed tiTELs and endTELs are indicated (n) (C) cl32 cells expressing LacI–YFP were treated with DOX or infected with retroviruses expressing TRF2ΔBΔM. TiTELs were visualized using the YFP fluorescence (in green in the merge panels), while ATM phosphorylated at Serine 1981 (pATM) and 53BP1 were visualized by indirect immunofluorescence (in red). The arrowheads point to tiTELs colocalizing with pATM and with 53BP1. Bar graphs represent the fraction of tiTELs colocalizing with pATM or with 53BP1. Bars and error bars are averages and standard deviations from three independent experiments. (D) Quantitative RT–PCR analysis of tiTERRA and of endogenous TERRA transcribed from 10q and Xp/Yp chromosome ends in cl32 cells infected with TRF2ΔBΔM-expressing retroviruses or with empty vector (EV) retroviruses. TERRA values are expressed as fold increase over EV-infected, untreated cells. Bars and error bars are averages and standard deviations from either two (Xp/Yp) or three (tiTERRA and 10q) independent experiments; P-values are indicated.

