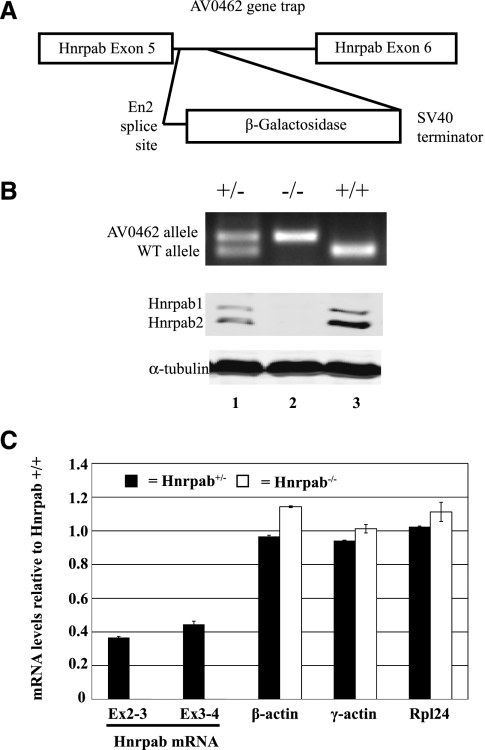
FIGURE 1.
AV0462 ES cell gene trap disrupts Hnrpab expression. (A) A diagram of the region of the Hnrpab gene showing the location of the gene trap insertion. (B, top) Typical PCR genotyping results for AV0462 gene trap heterozygous (lane 1), homozygous (lane 2), and wild-type mice (lane 3). (Middle) Western blots of protein lysates from cerebral cortex of P0 mice using antiserum raised against the N terminus of Hnrpab that recognizes both isoforms of the protein. (Bottom) The α-tubulin loading control to show equal protein loaded in all lanes. (C) The levels of mRNA in heterozygous (black box) or homozygous (white box) P0 cortex relative to wild type were determined using reverse-transcription real-time-PCR (RT–RT–PCR) and plotted above. The error bars represent variation of multiple PCR measurements. Hnrpab exon 2-3 and exon 3-4 were detected in Hnrpab−/− samples, but their decrease was so great that that they are essentially not visible on the chart.

