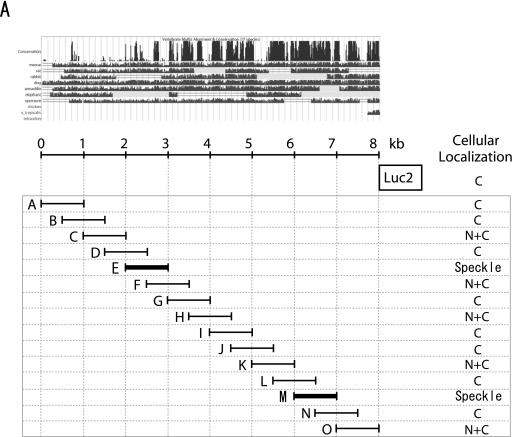
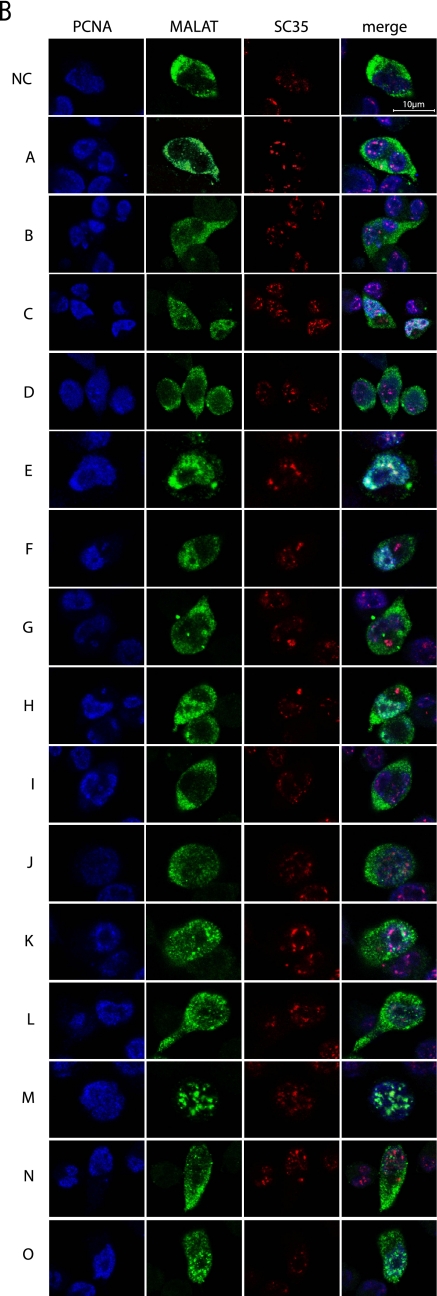
FIGURE 2.
Subcellular localization of MALAT-1 fragments. (A) Variants of MALAT-1 RNA used in the experiments. Luc indicates luciferase cDNA. Images from the UCSC Genome Browser (http://genome.ucsc.edu/) represent the data of evolutionary conservations among 17 vertebrates. The human MALAT-1 locus is shown at the top with the graduated sizes. The results of the subcellular distribution analysis are summarized in the right column. C and N+C indicate distribution in the cytoplasm, and nucleoplasm with cytoplasm, respectively. (B) FISH analyses of HeLa-TO cells, transiently transfected with the indicated MALAT-1 variants (green) are displayed, together with immunocytochemistry staining with an anti-PCNA (blue) and anti-SC35 antibody (red). Both images were merged to represent the subcellular localization of the MALAT-1 derivatives. Scale bar, 5 μm.


