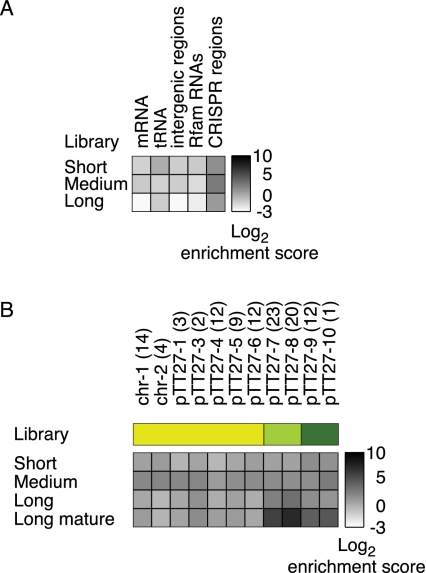
FIGURE 3.
Enrichment of different classes of RNAs in the treated libraries. (A) Global view on the enrichment of mRNA, tRNA, intergenic RNA, Rfam-annotated RNA, and CRISPR-derived RNA expression in the treated libraries. (B) Expanded view for each CRISPR region. Enrichment was calculated as the ratio between the fractions of uniquely mapped reads in the treated and untreated libraries for each gene category (displayed as log2 of the ratio). The rRNA category is omitted as it is not uniquely mapped because there are two copies of each rRNA gene. Number of spacers appears in parentheses. Although individual CRISPRs show enrichment variation both within and between libraries (short, medium, long), the CRISPR-annotated read category as a whole is the most enriched category in the treated versus untreated libraries.

