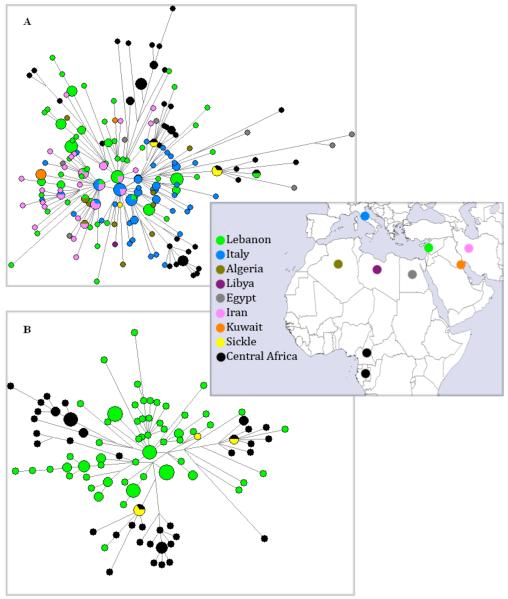
Figure 1.
Sample distribution and Reduced Median Network of R-M343. The map shows the location of the samples used in the Networks and the respective color for every population. A) Reduced Median Network of R-M343 from all indicated populations in the map. B) Reduced Median Network of R-M343 from Lebanon, Central Africa and Lebanese Sickle Cell disease patients.

