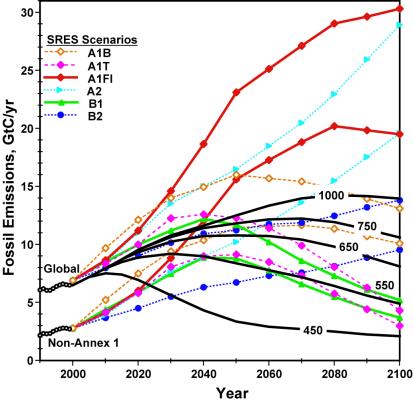
Figure 3.
Annual global fossil emissions of CO2. Emissions from 1990 to 1999 as a result of fossil fuel burning and cement production are shown by circles. Deduced global fossil CO2 emissions that lead to the concentration pathways toward stable CO2 concentrations ranging from 450 to 1,000 ppm given in Fig. 2 are shown by the labeled solid curves. Six SRES emission scenarios are shown by the curves with symbols. In addition to global SRES emissions, the emissions from non-Annex 1 countries are similarly shown, starting from the 1999 annual emissions of 2.7 Gt C.

