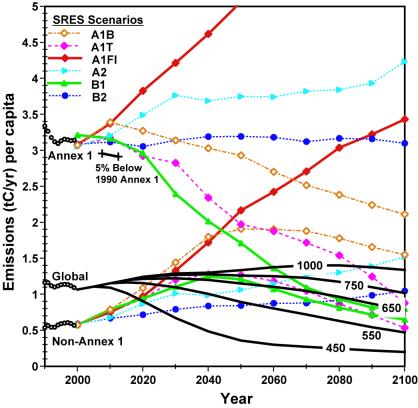
Figure 4.
Per-capita fossil emissions of CO2. Emissions per capita from 1990 to 1999 are shown by the circles. Emissions 5% below the 1990 Annex 1 rate over the period from 2008 to 2012 are shown by a line segment. Deduced global fossil emissions leading to the specified CO2 concentration pathways (Fig. 2) that asymptote to constant concentrations at labeled values from 450 to 1,000 ppm are shown by the solid curves. Per-capita fossil emissions for Annex 1 and non-Annex 1 regions for the six SRES scenarios are shown separately by the curves with symbols.

