
Figure 9.
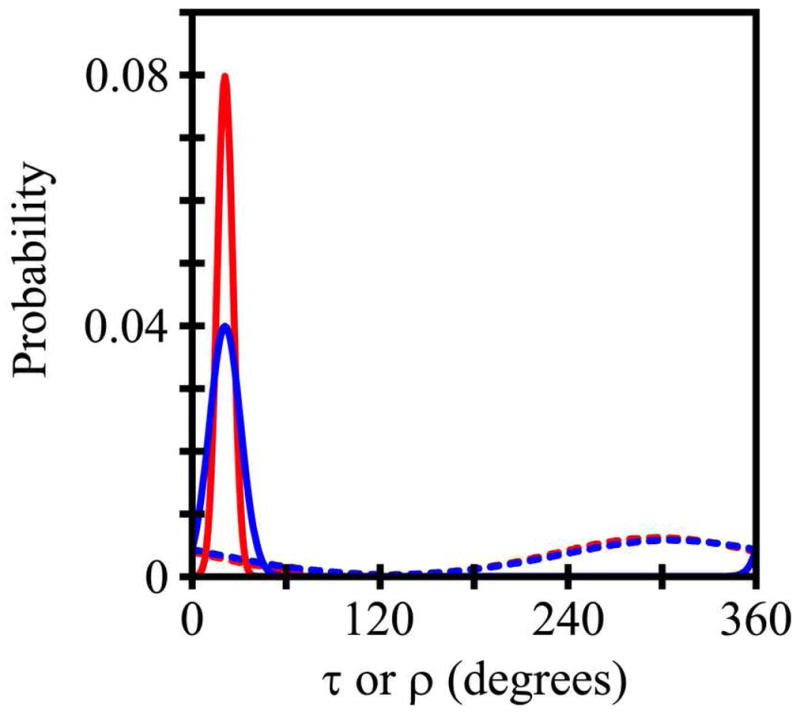
Curves to indicate the widths of the τ distributions (solid curves) and ρ distributions (dashed curves) for GWALP23 (red) and Y5GWALP23 (blue), based on Gaussian dynamics analysis of combined GALA and SAMPI4 measurements for each peptide in DMPC.