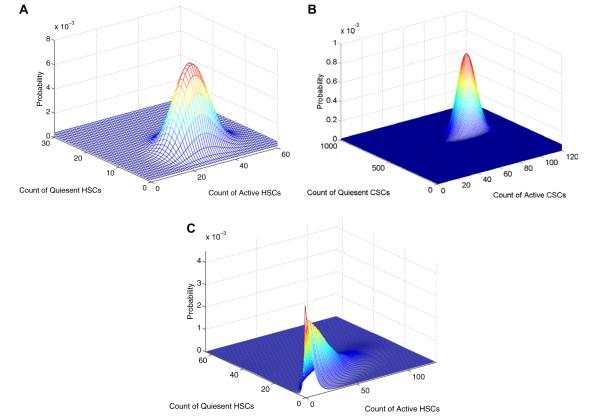
Fig. 9.
Dynamics of quiescent and active HSCs and CSCs at fixed and random extinction times. Top: Distribution of HSCs remaining at the mean extinction time of quiescent CSCs (114 weeks). Middle: Distribution of CSCs at the mean extinction time of active CSCs (18 weeks). Bottom: Distribution of HSCs at the random time of CSC extinction.

