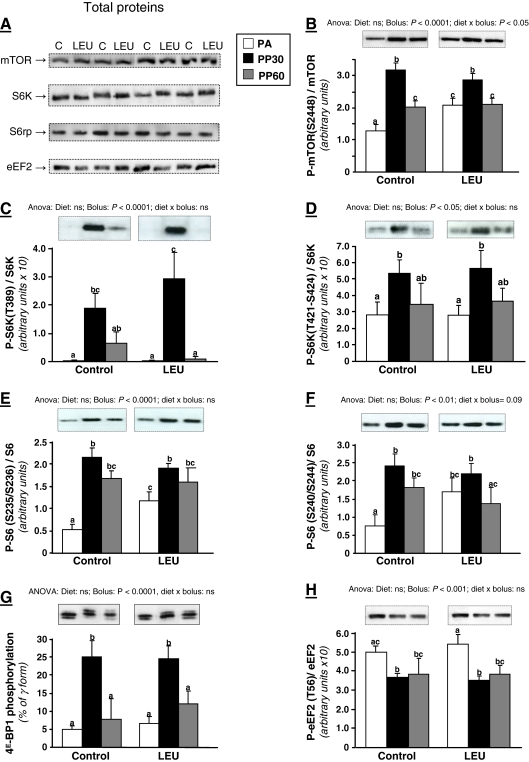
Fig. 4.
Muscle mTOR pathway analysis. Total proteins (a) and phosphorylation status of b mTOR (S2448), c S6K1 (T389), and d (T421/S424); e S6 (S235/236) and f (S240/244); g 4EBP1 and h eEF2 (T56) in gastrocnemius muscles from control and leucine-supplemented old rats after an overnight food deprivation (PA), 30 min (PP30), or 60 min (PP60) after gavage with a nutrient bolus. Values are means±SEM (n = 9–12 in each nutritional condition). Values with different letters are significantly different at least at P < 0.05

