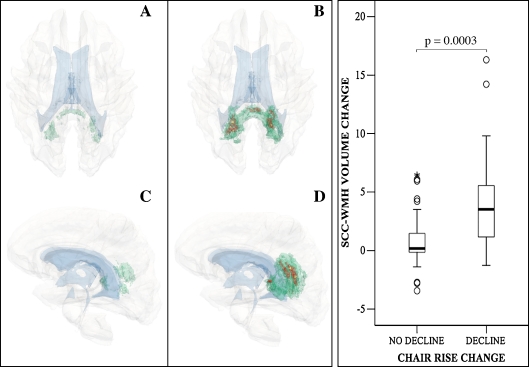
Fig. 3.
Accrual of WMH in the splenium of corpus callosum (SCC-WMH) and decline in chair rise mobility test. Three-dimensional models in A–D show the location and frequency range of new WMH in the no-decline (A, C) compared to the decline group (B, D). For clarity, models were filtered to show only new WMHs within the SCC region. Green indicates the location of new WMH present in up to 12% of subjects (A–D); red indicates the location of new WMH present in 13–24% of subjects (B, D); small areas in yellow indicate the location of new WMH present in 25–37% of subjects (b, d). View is from top in A, B and from left in C, D. Brain is transparent gray, lateral ventricles shown in light blue. Boxplots in the right panel show the range of change of SCC-WMH burden (y-axis) in the two groups indicated in the x-axis. Change in SCC-WMH was calculated as: [follow-up burden] − [baseline burden]. Thick horizontal line in the boxes indicates the group median. Circles, outliers; star, extreme outliers. The statistical significance (Mann–Whitney group comparison) of the difference is shown on top

