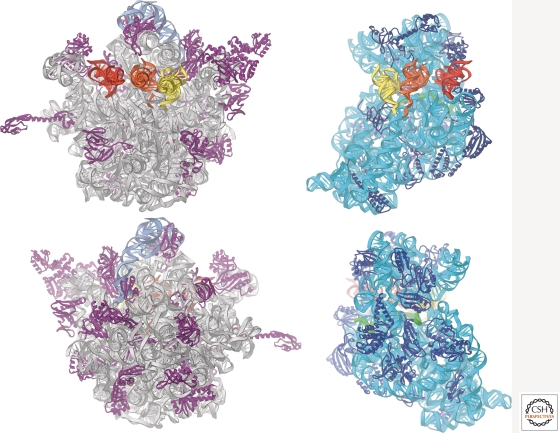
Figure 2.
Interface and solvent views of the 30S and 50S subunits, as observed in the 70S ribosome crystal structure (Yusupov et al. 2001), showing the positions of the A-, P- and E-site tRNAs (yellow, orange, and red, respectively). Top, interface views of the 50S (left) and 30S (right) subunits, showing the relative absence of proteins surrounding the functional sites. Bottom, corresponding solvent surfaces of the subunits.

