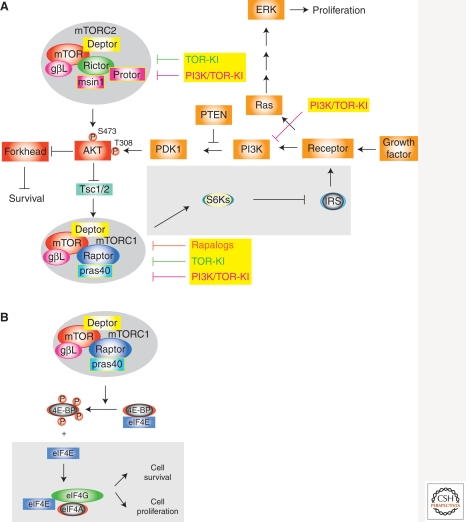
Figure 1.
Diagram illustrating rapamycin-resistance pathways. (A) Inhibition of mTORC1 by rapalogs leads to dampening of the S6K/IRS feedback loop (in gray box) and increased signaling flux to PI3K and Ras. (B) Increased levels of eIF4E can circumvent effects on cell proliferation and cell survival (in gray box) mediated by inhibition of mTORC1 by rapamycin. See text for details.

