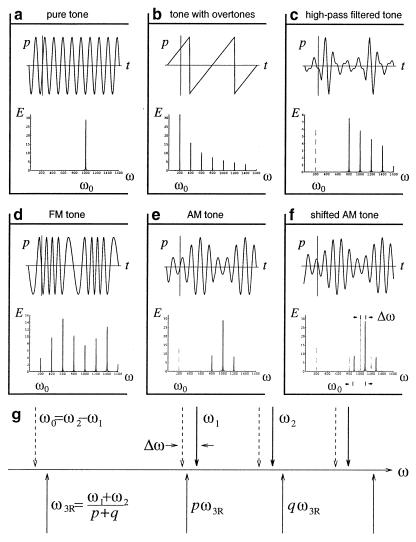
Figure 1.
Stimuli: waveforms, Fourier spectra, and pitches. (a) A 1-kHz pure tone; the pitch coincides with the frequency ω0. (b) Complex tone formed by 200-Hz fundamental plus overtones; the pitch is at the frequency of the fundamental ω0. (c) After high-pass filtering of the previous tone to remove the fundamental and the first few overtones, the pitch ω0 remains at the frequency of the missing fundamental (dotted). (d) The result of frequency modulation of a 1 kHz pure tone carrier by a 200-Hz pure tone modulant. (e) Complex tone produced by amplitude modulation of a 1-kHz pure tone carrier by a 200-Hz pure tone modulant; the pitch coincides with the difference combination tone ω0. (f) The result of shifting the partials of the previous tone in frequency by Δω = 90 Hz; the pitch shifts by Δω0 ≈ 20 Hz, although the difference combination tone does not. (g) Schematic diagram of the frequency line details (above the line) the pitch shift behavior of f and (below the line) the three-frequency resonance we propose to explain it.

