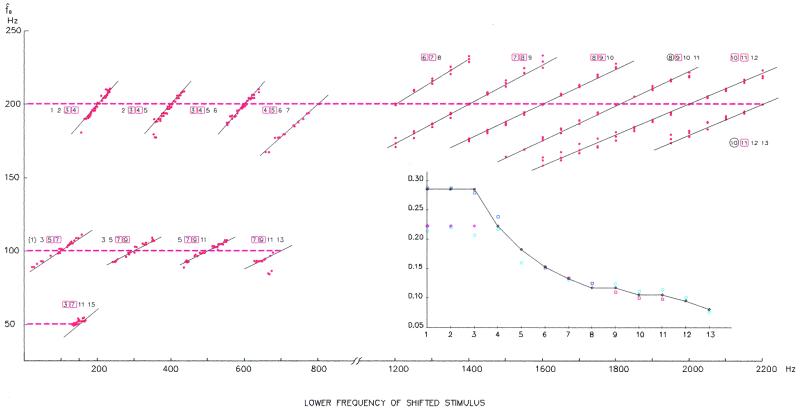
Figure 2.
Experimental data (red dots) from Gerson and Goldstein (14) and from Schouten et al. (8) (1200–2200 Hz range) show pitch as a function of the lower frequency f = kω0 + Δω of a complex tone {kω0 + Δω, (k + 1)ω0 + Δω, (k + 2)ω0 + Δω, . . .} with the partials spaced g = ω0 = 200 Hz apart. The data of Schouten et al. are for three-component tones monotically presented (all of the stimulus entering one ear), and those of Gerson and Goldstein for four-component tones dichotically presented (part of the stimulus entering one ear and the rest of the stimulus the other, controlateral, ear); the harmonic numbers of the partials present in the stimuli are shown beside the data. The pitch-shift effect we predict from three-frequency resonance, taking into account the dominance region, is shown superimposed on the data as solid lines given by the equations P = g + (f − n g)/(n + 1/2) (primary lines), P = g/2 + (f − (n + 1/2)g)/(2n + 2) (secondary lines), and P = g/4 + (f − (n − 1/4)g)/(4n + 1) (tertiary line); the harmonic numbers of the partials used to calculate the pitch-shift lines are shown enclosed in red squares. For primary lines these harmonic numbers correspond to n and n + 1, for secondary lines to 2n + 1 and 2n + 3, and for the tertiary line to 4n + 1 and 4n + 5. A red circle, instead of a square, signifies that the component is not physically present in the stimulus, but corresponds to a combination tone. The Inset corresponds to the slopes of the data averaged over the distinct experimental values plotted as a function of harmonic number. The blue squares are the data of Gerson and Goldstein, the red squares are those of Schouten et al., and lastly, the blue circles are data of Patterson (15) for six- and twelve-component tones, which are averaged over different experimental situations that represent several thousand points. The black diamonds correspond to our theory and show that the data of Gerson and Goldstein and those of Patterson saturate for different values of k (the experimental conditions were different).

