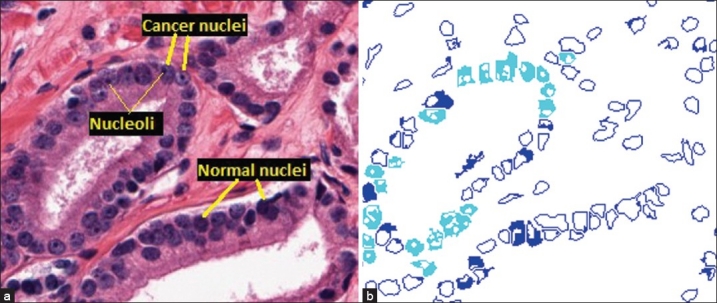
Figure 2.

Nucleus segmentation and classification. (a) Cancer and normal nuclei in a 20× tissue region. (b) Results of the nucleus segmentation and classification. Cyan regions are cancer nuclei and blue regions are normal nuclei. The blank areas inside each nucleus region are the segmented dark spots obtained by the maximum object boundary binarization algorithm. In cyan regions, these spots are round and small in size, which are considered nucleoli. In blue regions, these spots are either elongated or much larger in size, which are not considered nucleoli
