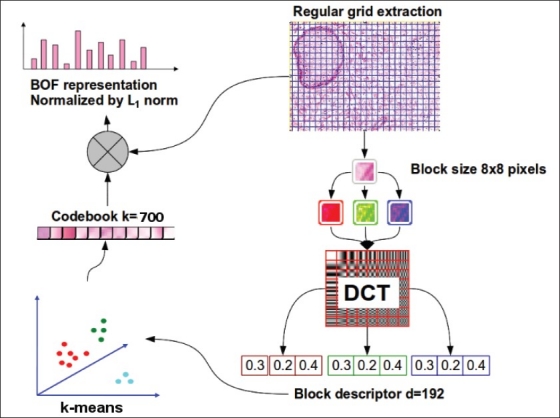
Figure 3.

Bag of feature setup used for representing histopathology images. In this work the local features extraction is performed using regular grid extraction and each patch of 8 × 8 pixels is represented by the first coefficients of a discrete cosine transform applied to each color component (RGB) independently, the visual codebook is built using k-means with k = 700, and finally each image is represented by a histogram of 700 bins normalized with L1 norm
