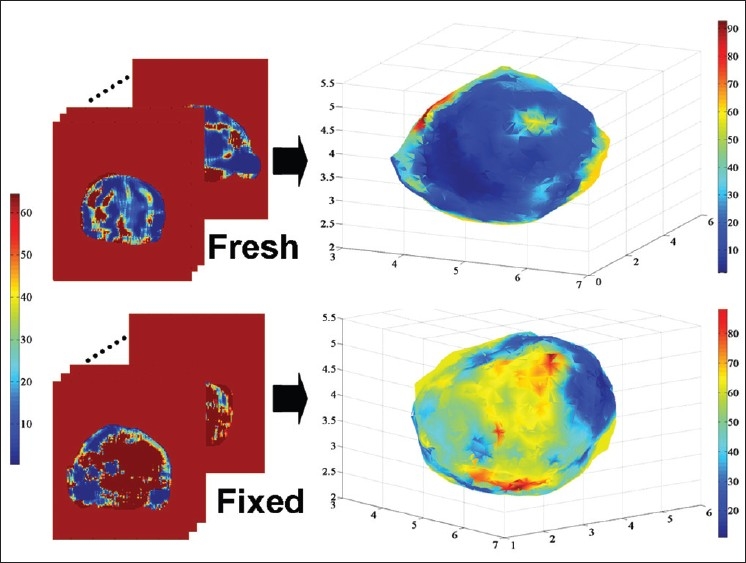
Figure 3.

Material model construction based on MRE data. Each element of the model is assigned an E value from the MRE data. The top and the bottom left image sets are the MRE fresh and fixed scans, respectively. The top and the bottom right images display the reconstructed FEM after assigning the E values from MRE. The axes on the right side images represent the position in centimeter. Color maps show the E values in KPa. In the fresh-state E-maps variations in E were noted for diseased tissue and across normal anatomy. Fixation increases Young modulus nonuniformly and as an approximate function of distance from the tissue edge
