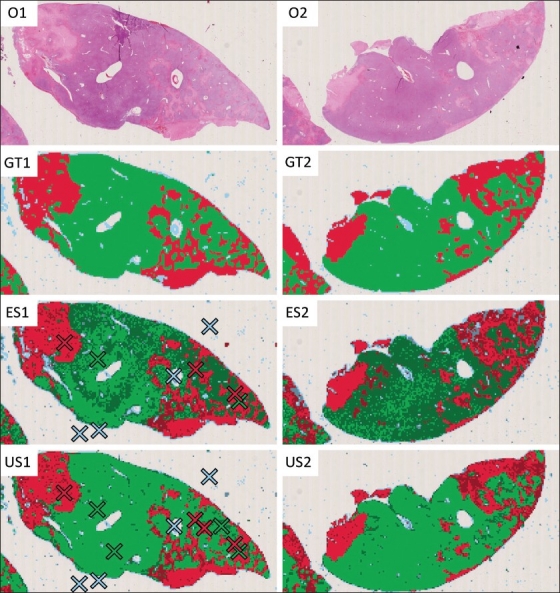
Figure 2.

Uncertainty sampling by the example of an image analysis method for quantifying necrosis. The images O1 and O2 show rat liver sections affected by confluent necrosis. To quantify the proportion of necrotic tissue, each section is divided into square image objects that are classified as either “viable tissue” (green), “necrotic tissue” (red) or “background” (blue). The images GT1 and GT2 show the respective ground-truth classifications provided by a human expert. Image ES1 shows the classification result after error sampling. Although the result already closely resembles the ground truth, many image objects are still uncertainly classified, as indicated by the darker color. Image US1 shows the classification result after uncertainty sampling. Although the selection of three additional samples has no major impact on the classification quality, it reduces the overall uncertainty to a negligible level. In the images ES2 and US2, the respective classification models obtained from ES1 and US1 were applied to the second section without modification. Obviously, uncertainty sampling both improved the classification accuracy and confidence
