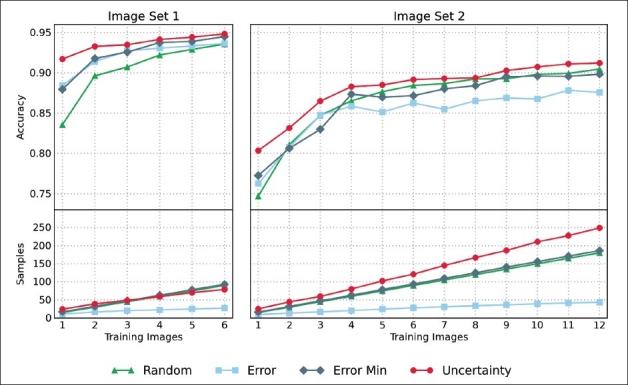
Figure 3.

The results of the training simulation. The left column shows the results for image set 1, the right column shows the results of image set 2. The upper row plots the number of training images against the respective mean accuracy of the generated classification model. The lower row plots the number of training images against the respective mean number of samples that were selected during the training process
