
Figure 2.
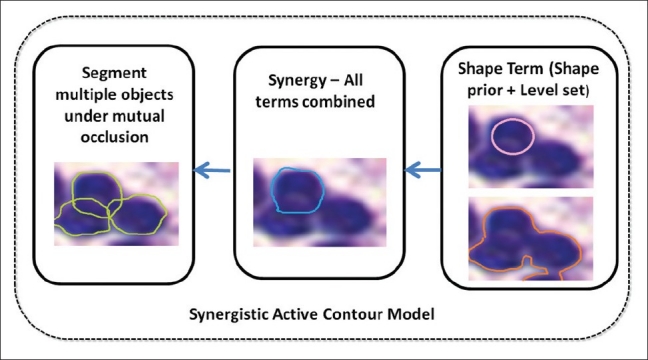
Flow chart showing the various modules comprising our segmentation scheme. First panel illustrates shape prior and region-based term. Second panel illustrates the synergy of both the terms
Official websites use .gov
A
.gov website belongs to an official
government organization in the United States.
Secure .gov websites use HTTPS
A lock (
) or https:// means you've safely
connected to the .gov website. Share sensitive
information only on official, secure websites.
Flow chart showing the various modules comprising our segmentation scheme. First panel illustrates shape prior and region-based term. Second panel illustrates the synergy of both the terms