
Fig. 6.
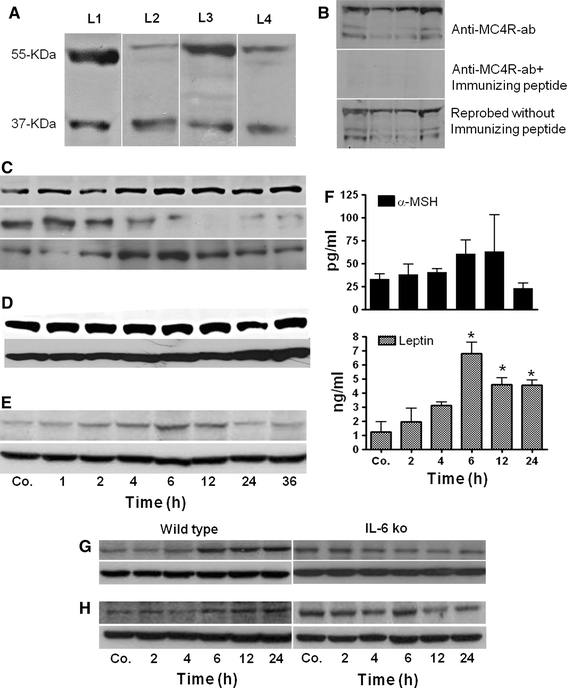
Detection of MC4R and MC3R by Western blot analysis of rat liver and brain. a Western blot analysis revealed two immunoreactive bands: one at 37 kDa and a second at 55 kDa. Lane (L)1 contains rat liver total lysate, L2 liver cytosolic extraction, L3 liver nuclear extracts and L4 total protein of cultured rat hepatocytes. b Top rat liver total lysates with immunoreactive bands at 37 and 55 kDa, middle after neutralizing the anti-MC4R antibody with a specific immunizing peptide. Bottom reprobing of the same membrane with the antibody against MC4R without immunizing peptide. c Changes in MC4R protein level during APR. Top contains rat liver total lysate, middle liver cytosolic extraction, bottom liver nuclear extracts. d Identification and changes in MC4R level in rat brain total lysate during APR, e detection and changes of MC3R level in rat liver total lysate. f Changes in serum concentration of α-MSH and leptin during APR. α-MSH (top) and leptin (bottom) levels were measured with enzyme-linked immunosorbent assay (ELISA). Results represent mean value ± SEM (*P < 0.05 analyzed by one-way ANOVA; n = 3). g Detection of MC4R in the liver of wild-type and IL-6-ko mice during APR. Total protein lysate of mouse liver after TO administration; h total protein lysate of mice liver after LPS treatment. β-actin (43 kDa) was used as equal loading control in Western blot analysis. Results show the representative picture of three animals