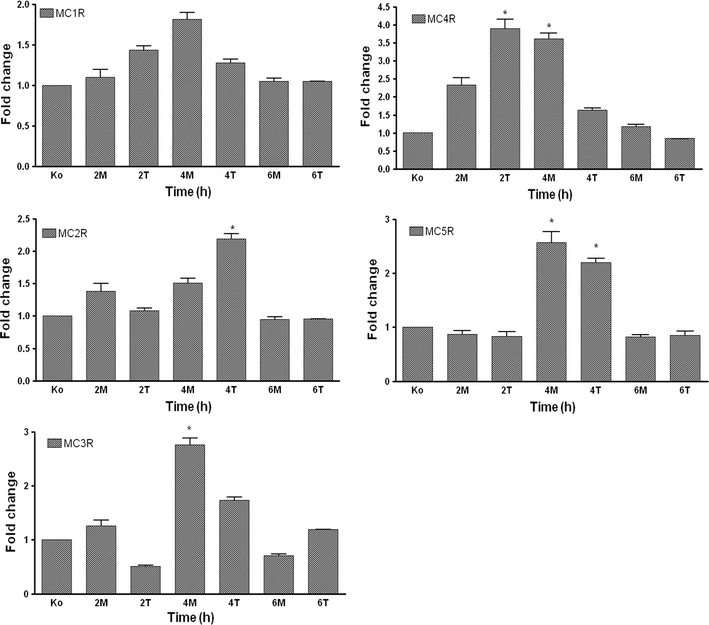
Fig. 9.

RT-PCR analysis of total RNA from rat isolated Kupffer cells treated with α-MSH and THIQ. Data shown as fold changes in mRNA expression of MC1R, MC2R, MC3R, MC4R and MC5R at different time points related to untreated controls for each time point. qRT-PCR was normalized by using two housekeeping genes: β-actin and ubiquitin C. Results represent mean value ± SEM of three experiments, *p < 0.05
