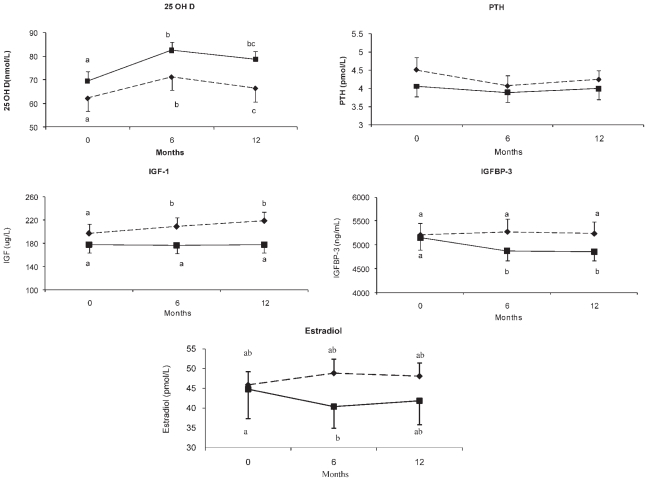
Fig. 3.
Changes in 25-hydroxyvitamin D [25(OH)D], parathyroid hormone (PTH), estradiol, insulin-like growth factor 1 (IGF-1), and insulin-like growth factor–binding protein 3 (IGFBP-3) during the intervention in the two groups. The influence of diet over time on these hormones was analyzed by two-factor repeated-measures ANOVA (diet × time =D × T). Values with different superscript letters are significantly different. Diamond and dotted line represents HP (n =26); square and solid lines represent NP (n =21).

