Figure 3.
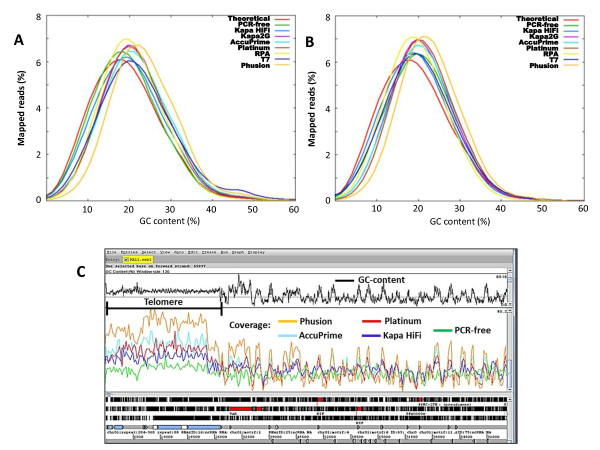
GC profile analysis of sequenced data. The GC content distribution for different library preparation methods are shown alongside theoretical data for comparison. A) GC content analysis on libraries prepared from P. falciparum 3D7 with mapped reads normalized to 21× genome coverage. B) GC content of libraries prepared from a clinical isolate (PK0076) with mapped reads normalized to 11× genome coverage. Libraries with GC content above 19.4% (the GC content of the P. falciparum 3D7 reference genome) indicate amplification bias towards templates with neutral GC composition. C) Artemis [9,10] screen view of coverage (mapped reads normalized to 21× genome coverage) for a PCR-free library and four other libraries under test on P. falciparum 3D7 chromosome 1 (zoomed in to show coverage on the GC rich telomere). Kapa HiFi, Kapa2G and Platinum pfx enzymes were used in the presence of TMAC. See additional file 1, Figure S2 A & B for coverage on the entire chromosome 1 and AT-rich locus.

