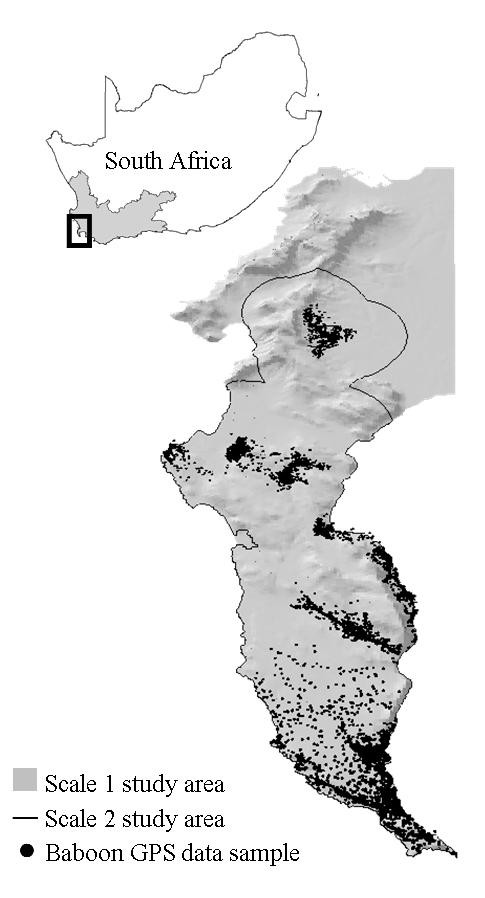
Figure 1.

Geographical location of the model study areas. A map of South Africa (inset) with the black block indicating the Cape Peninsula in the Western Cape Province (shaded grey). The larger map shows the Scale 1 (entire grey area) and Scale 2 (within the black outline) study areas used in the hurdle models, and includes the sample of baboons GPS datapoints (n = 9000) used in the models.
