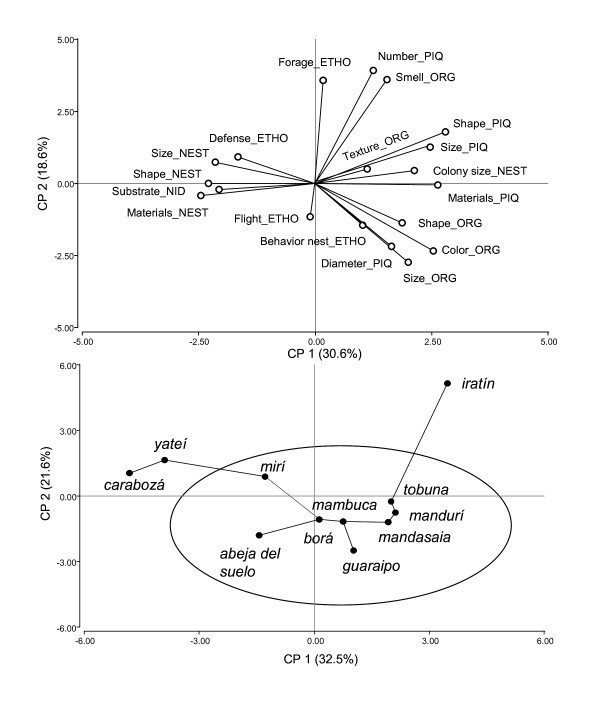
Figure 3.
Graphic representation of Principal Component Analysis (PCA). Figures a and b are part of one graph but they were separated for a better reading. a) Distribution of descriptors (components) according to axis 1 and 2, b) Distribution of ethnospecies with minimal spanning tree. Abbreviations, (descriptor_criterion): ORG = organoleptic; PIQ = piquera; ETO = ethological; Defense = defense against non-human enemies; Materials = materials for building (piquera or nest); Number = number of piqueras, Substrate = nest substrate.

