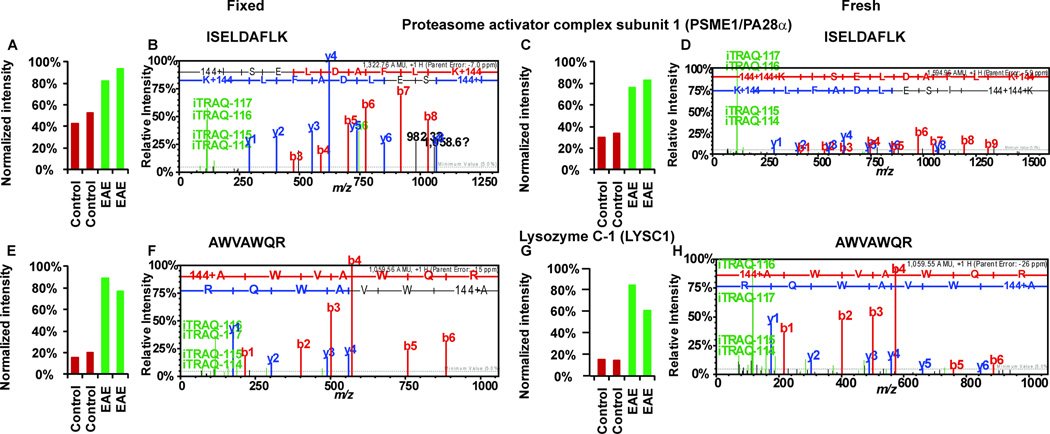
Fig 3. Sample MS/MS spectra from iTRAQ neuroproteomics analyses of FFPE and frozen spinal cords.
P28α peptide 37ISELDAFLK45 (FFPE, A–B; frozen, C–D) and Lysozyme C-1 peptide 126AWVAWQR132 (FFPE, E–F; frozen, G–H). Peptide sequences were deduced from MS/MS spectra based on the observation of a continuous series of either N-terminal (b-series) or C-terminal (y-series) ions (B, D, F and H). The peak areas (A, C, E and G) of iTRAQ quantification ions m/z 114–117 were used to measure the relative abundance of individual peptides. Red bars represents intensities in control samples (labeled with iTRAQ reagent 114 and 115) and green bar represents intensities in EAE samples (labeled with iTRAQ reagent 116 and 117). All the peptides shown here were more abundant in EAE samples; therefore, EAE peaks were elevated relative to the control peptide peaks (A, C, E and G). Quantitative information from iTRAQ was comparable between the analyses of fixed spinal cords and the frozen samples (A compared to C and E compare to G). Mass spectra (B compared to D and F compared to H) of the same peptide were comparable among fixed and fresh samples.

