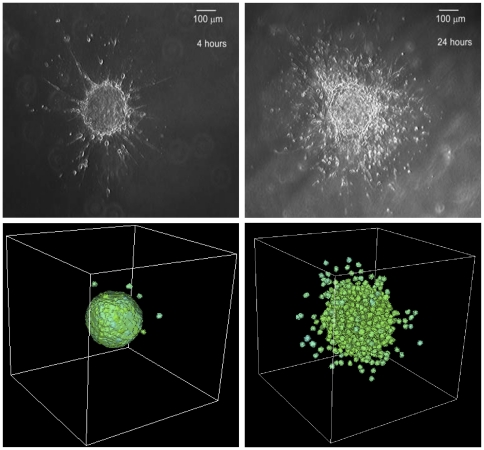
Figure 11. Comparison between our computational results with experimental data.
Images showing experimental data of MTS growth patterns in low collagen concentration (top left figure), a less invasive pattern, and in high collagen concentration (top right figure), a more invasive pattern. Our computational simulation results (bottom right figure with  and bottom left figure with
  ) are comparable to the experimental data. The simulation results were taken at
  MCS. Reprinted from Biophysical Journal, 89/1, L. Kaufman, C. Brangwynne, K. Kasza, E. Filippidi, V. Gordon, T. Deisboeck, and D. Weitz, Glioma expansion in collagen I matrices: analyzing collagen concentration-dependent growth and motility patterns, 635–650, Copyright (2005), with permission from Elsevier [OR APPLICABLE SOCIETY COPYRIGHT OWNER].

