
Figure 1.
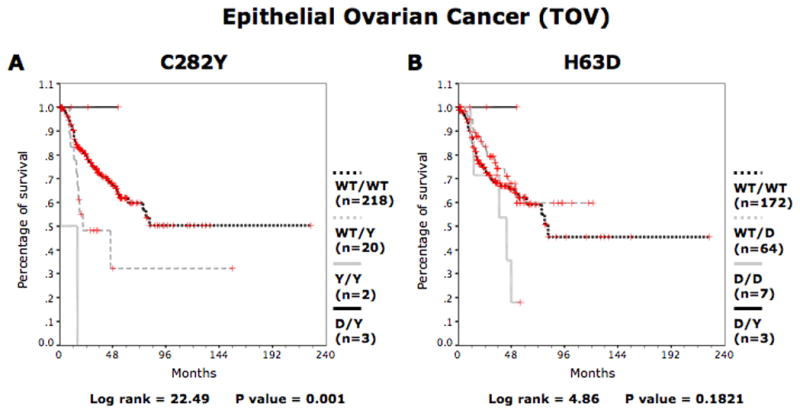
Kaplan-Meier survival curves for the entire group of TOV patients according to HFE genotype. For patients with invasive epithelial ovarian cancer overall survival curves are shown for (a) WT/WT, WT/Y, Y/Y and D/Y patients and (b) WT/WT, WT/D, D/D and D/Y patients. D represents H63D allele. Y represents the C282Y allele. [Color figure can be viewed in the online issue, which is available at wileyonlinelibrary.com.]