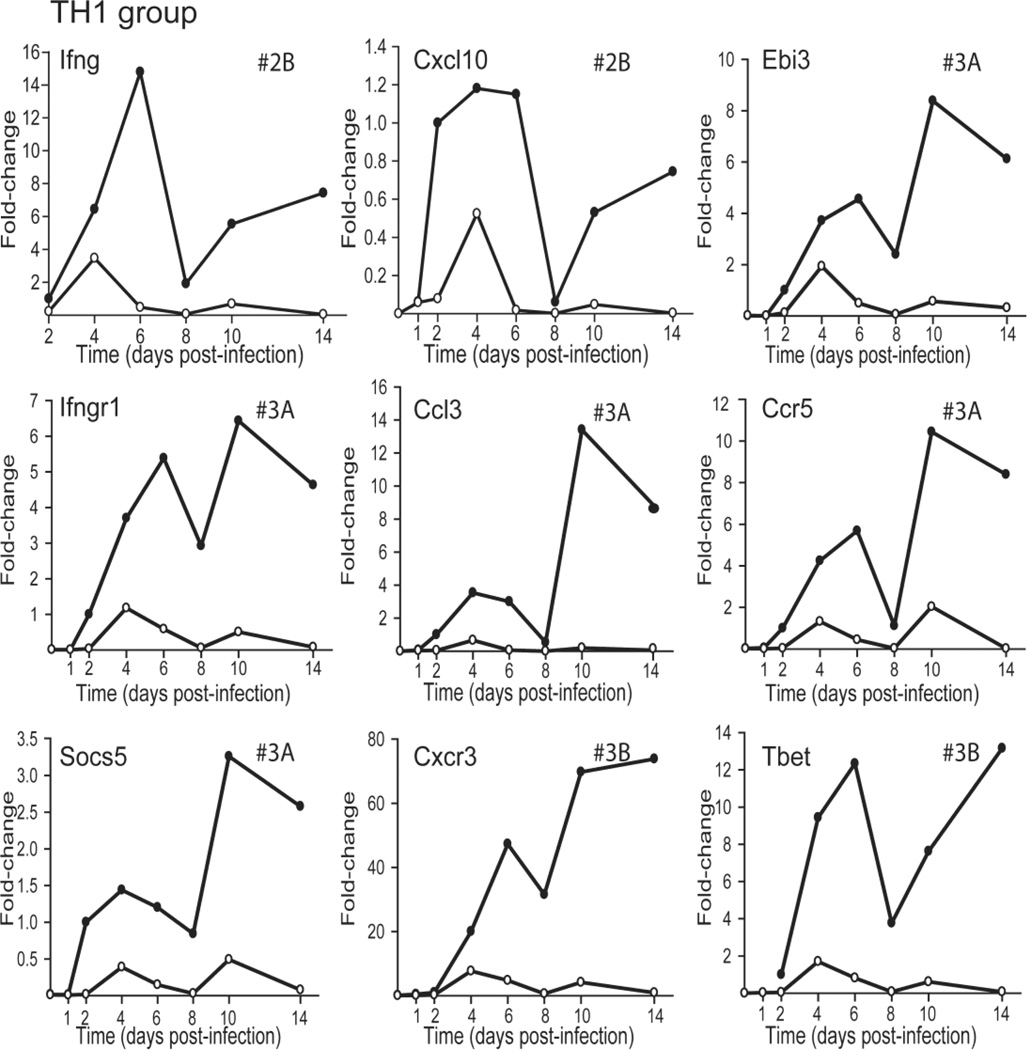
FIG. 4.
Relative change in expression profiles of TH1 related genes after CVB4-V infection of BALB/c and IL-10 KO mice. Three-to-five mice per strain were analyzed at each time point and gene expression in the pancreas was quantified using the TaqMan Gene Expression Assay in a two-step RTPCR and a low-density array. The Ct value of each test gene was normalized to an endogenous control, egf, and the [delta] Ct values for samples at each time point were averaged. The change in gene expression is represented as a fold-change relative to the expression level of a reference group, CVB4-V-infected BALB/c at 2dpi. As a result, the relative expression of a gene in BALB/c mice at 2dpi is 1. Closed circles, BALB/c mice; open circles, IL-10 KO mice.

