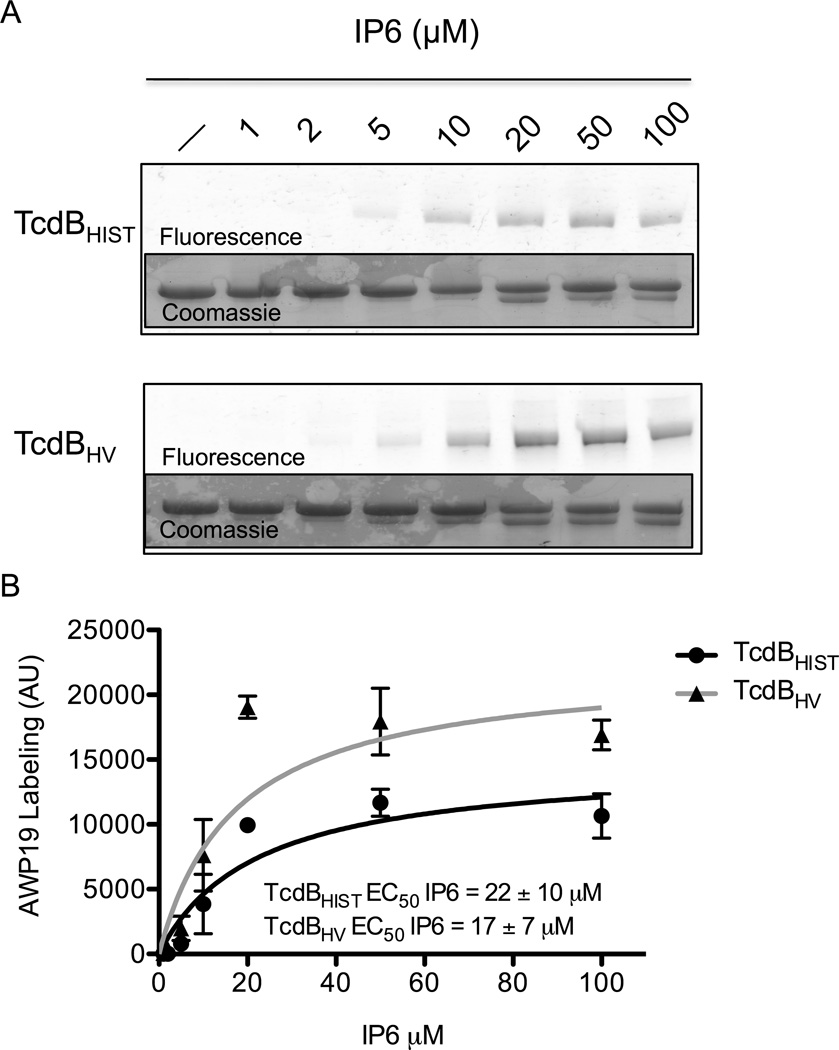
Fig. 2. Comparison of cysteine protease activation with the activity-based probe AWP19.
(A) Representative fluorescent gel image of the IP6 induced labeling of TcdBHIST (top) or TcdBHV (bottom) by AWP19. The in vitro cleavage assay was allowed to come to completion with the indicated concentration of IP6, then the gel was imaged for FITC fluorescence. Inset: Coomassie stained gel verifying equal loading. (B) Densitometry indicating the average fluorescence intensity (arbitrary units) of TcdBHIST (black) and TcdBHV (gray) at the indicated IP6 concentrations. The activation constant (EC50), is defined as the concentration of IP6 at which half-maximal activity occurs. Error bars represent the S.D. of 4 independent experiments.

