Fig. 1.
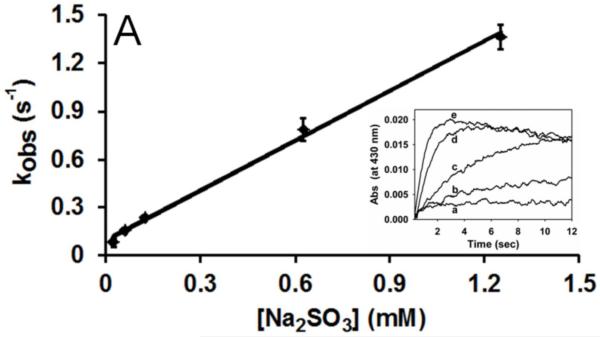
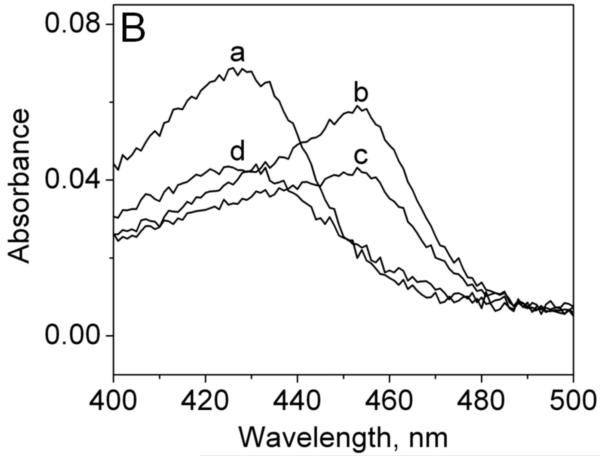
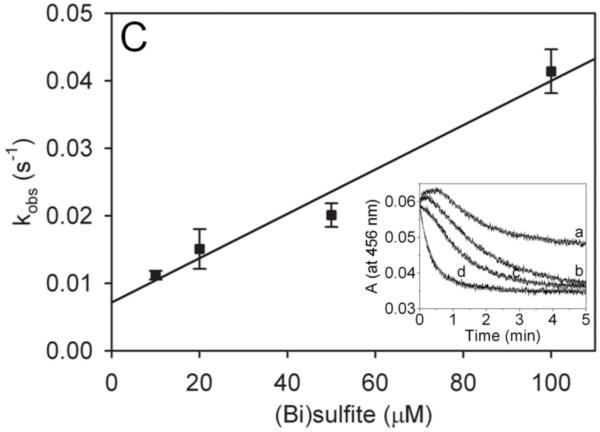
Reduction of MPO-compound II by sulfite. (A) Pseudo-first-order rate constants for reduction of MPO-compound I by (bi)sulfite. The second-order rate constant is calculated from the slope. The inset shows the time traces of the reaction followed at 430 nm using the sequential mixing mode. Final concentrations were 1.25 μM MPO and12.5 μM H2O2, and the concentration of (bi)sulfite for each time trace was (a) 12.5 μM, (b) 62.5 μM, (c) 125 μM, (d) 625 μM, and (e) 1.25 mM. (B) Spectral changes upon addition of 50 μM Na2SO3 to MPO-compound II. The resting MPO was recorded first (spectrum a). MPO-compound II was formed by mixing 400 nM ferric MPO with 300 nM homovanillic acid (HVA) and 50 μM H2O2 and waiting for 1 min (b). Spectrum c was taken 5 min after the addition of sulfite, and the resting enzyme was reformed after 30 min (spectrum d). (C) Pseudo-first-order rate constants for reduction of MPO-compound II by (bi)sulfite. The inset shows the time traces and fits of the reduction of compound II at pH 7.4 by Na2SO3. The concentration of (bi)sulfite for each time trace was (a) 10 μM, (b) 20 μM, (c) 50 μM, and (d) 100 μM.


