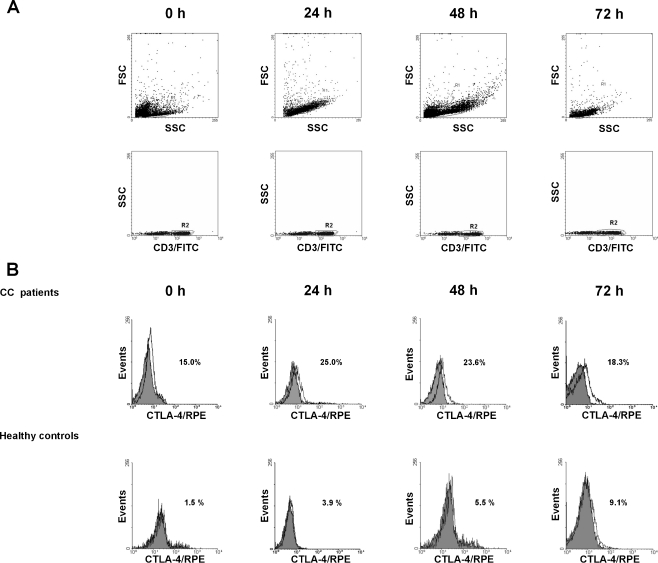
Fig. 3.
Surface CTLA-4 expression in peripheral blood CD3+ cells from patients with CC and from healthy controls before and after 24 h, 48 h and 72 h stimulation with anti-CD3 MoAb + rIL-2. The dot plots and histograms show representative data, illustrating the analysis method for identification of CD3+ cells expressing CTLA-4 molecule following double-color staining. (a) The dot plots show the forward scatter/side scatter (FSC/SSC) distribution and the gate (region R1) was used to select lymphocytes for analysis. The R1 gated events were then analyzed for CD3/FITC staining and CD3-positive cells were gated (region R2). The dot plots show representative data from one patient with CC. (b) The final histograms. The double-gated populations were then analyzed for CTLA-4 expression. The gray histograms represent the isotype controls. The numbers located on the histograms represent the percentage of CD3+ cells expressing surface CTLA-4

