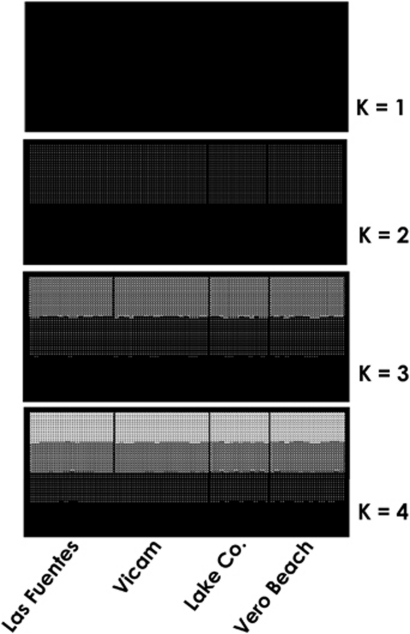
Figure 3.
Genetic clustering of sexual Ischnura hastata, based on nine microsatellite loci. Estimated population structure (from K=1 to K=4). Sampled localities (labelled below the figure) are separated by black lines. Each individual is represented by a narrow vertical column with the proportion of the colors indicating the genome proportion derived from each population.

