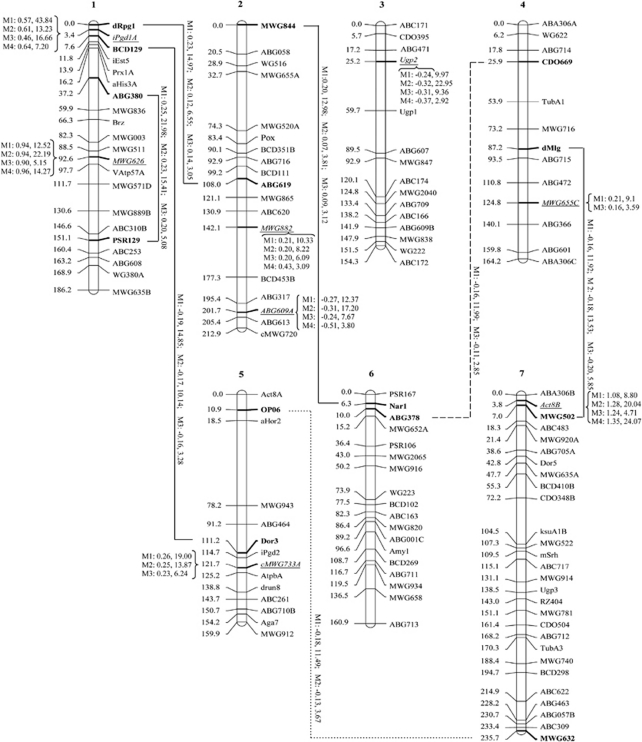
Figure 3.
The locations and effects of QTL detected with the BSPML (M1), eBayes (M2), LASSO (M3) and composite interval mapping (M4) methods. The effects and LOD scores for the detected QTL are also given in the figure. For the main-effect QTL, effects and LOD scores are placed at the positions of the detected QTL. For the epistatic QTL, the effects and LOD scores are placed along with the lines that connect the interacting loci. Solid lines indicate that the interactions were detected by all three methods. Dotted lines indicate that the interactions were detected by only two methods.

