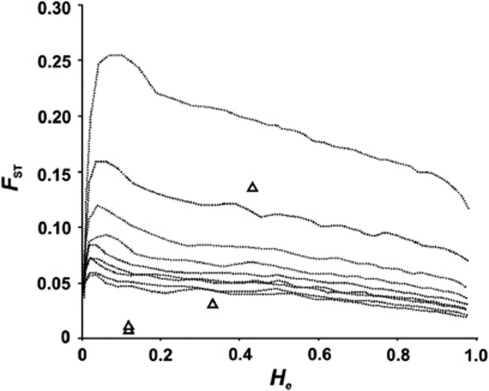
Figure 5.
The upper 95% confidence limits from simulations of different levels of migration for the sex chromosomes in comparison with autosomes. Migration levels (from uppermost dashed line to lowest dashed line) are 0.1, 0.2, 0.3…0.9 of the autosomal level. Only the sex-linked markers are depicted here. Follistatin remains an outlier in all of the calculations, bar in the event that the sex chromosome migration rate is 0.1 of that of the autosomes.

