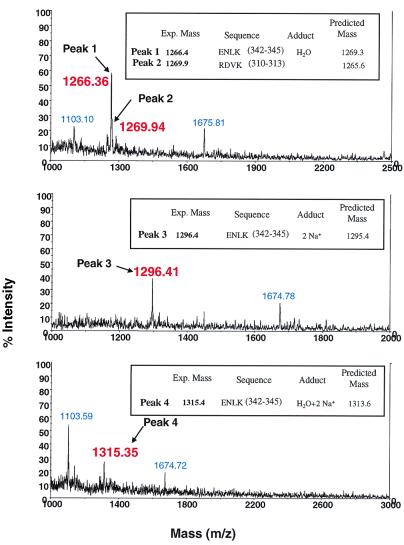
Figure 7.
MALDI analysis of the MBB-labeled tryptic fragments of T2 obtained after avidin affinity purification (Fig. 3B, ). Peaks labeled in red are the identified fragments. Amino acid sequences and the predicted masses of these fragments are indicated in the insets. Unidentified peaks labeled in blue also appeared in the two control samples (trypsin alone and Tα-MBB alone, data not shown).

