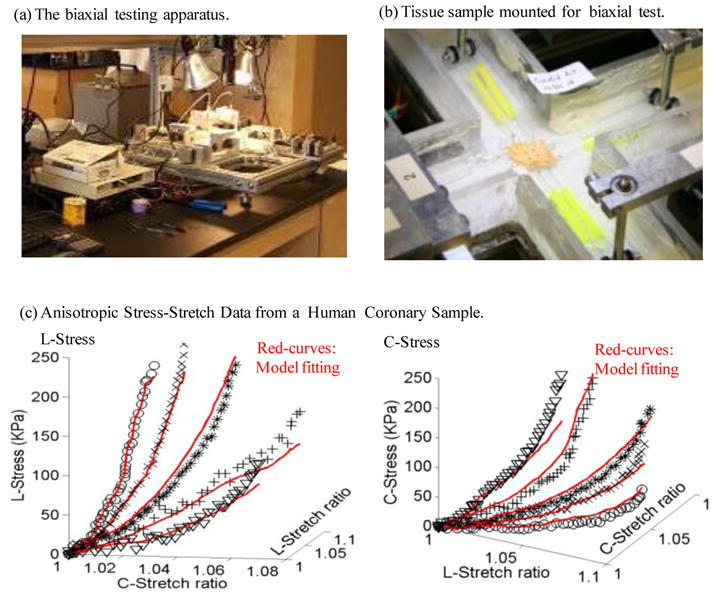
Figure 4.

The biaxial testing apparatus and sample results showing 3D plots of measured stress-stretch data from a human carotid sample with fitting curves by the anisotropic Mooney-Rivlin model. Markers for protocols with 5 axial:circumferential stress ratios: * : 1:1; X : 1:0.7; O: 1:0.5; +: 0.7:1; V:0.5:1.
