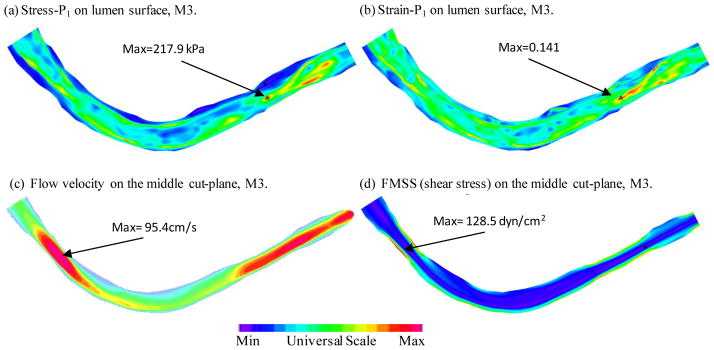
Figure 8.

Plots of Stress-P1, Strain-P1, flow velocity and flow maximum shear stress from the model with higher pressure conditions. Inlet pressure Pmax=150 mmHg, Pmin = 80 mmHg Outlet pressure was adjusted accordingly.

Plots of Stress-P1, Strain-P1, flow velocity and flow maximum shear stress from the model with higher pressure conditions. Inlet pressure Pmax=150 mmHg, Pmin = 80 mmHg Outlet pressure was adjusted accordingly.