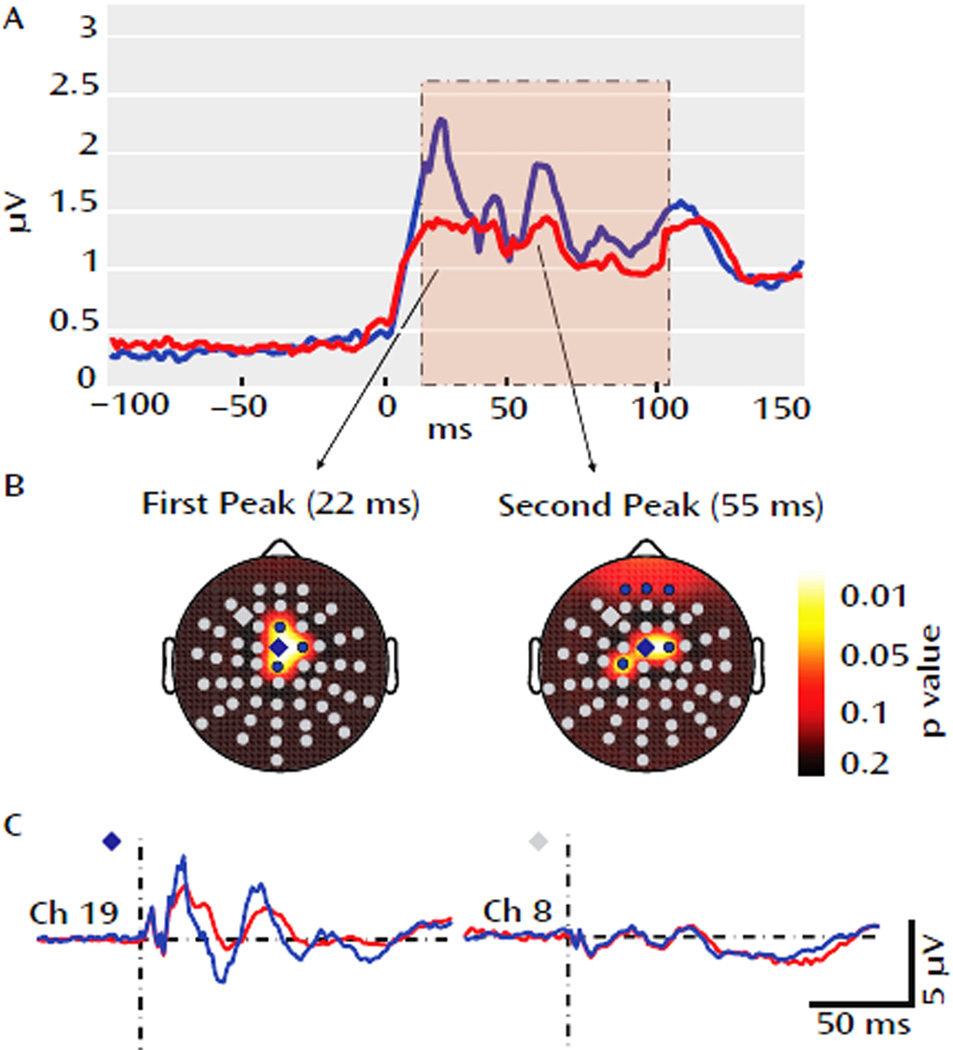
Figure 11. EEG response to TMS stimulation in schizophrenic patients and healthy controls.
(A). The global mean field power derived from all 60 electrodes. Relative to controls (blue), the global mean field power was decreased in schizophrenic patients (red) between 12 and 100 ms following TMS (pink area). The decrease peaked at 22 and 55ms. (B) The electrode topography of the two peaks, demonstrating the electrodes with significantly different TMS-induced activity between healthy subjects and controls (blue electrodes). There are four centrally located electrodes with differential activity at 22ms, and 6 electrodes (3 central, 3 frontal) with differential activity at 55 ms. (C) Grand averages for a significant electrode (blue diamond) and nonsignificant electrode (gray diamond) in schizophrenic patients (red) and controls (blue). (Modified with permission from Ferrarelli et al, 2008).

