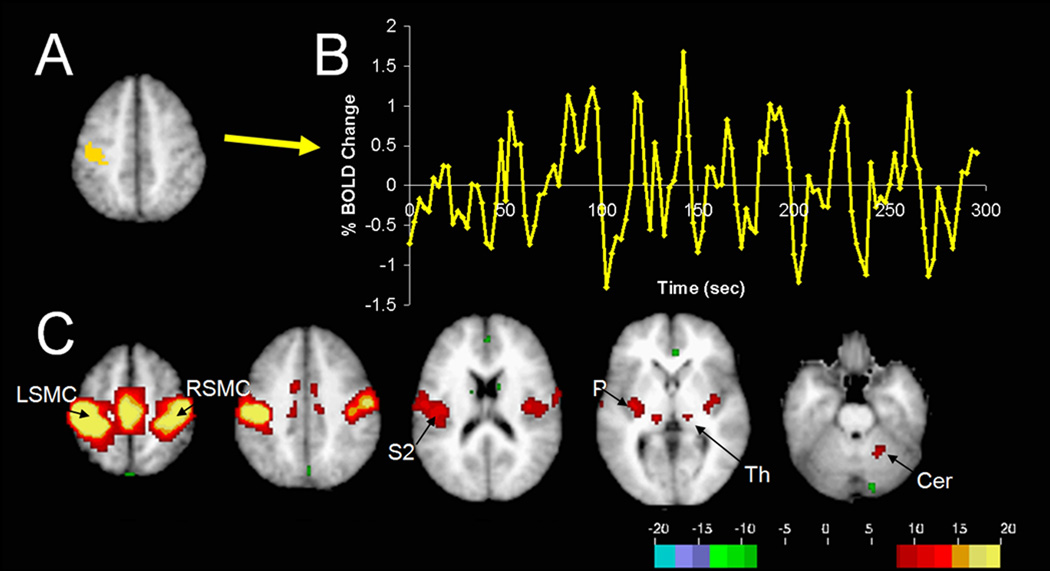
Figure 3. Generation of resting-state correlation maps.
(A) Seed region in the left somatomotor cortex (LSMC) is shown in yellow. (B) Time course of spontaneous BOLD activity recorded during resting fixation and extracted from the seed region. (C) Voxels significantly correlated with the extracted time course assessed using a random effects analysis across a population of ten subjects (Z score values). In addition to correlations with the right somatomotor cortex (RSMC) and medial motor areas, correlations are observed with secondary somatosensory association cortex (S2), posterior nuclei of the thalamus (Th), putamen (P), and cerebellum (Cer). Reproduced with permission from (Fox and Raichle 2007).

