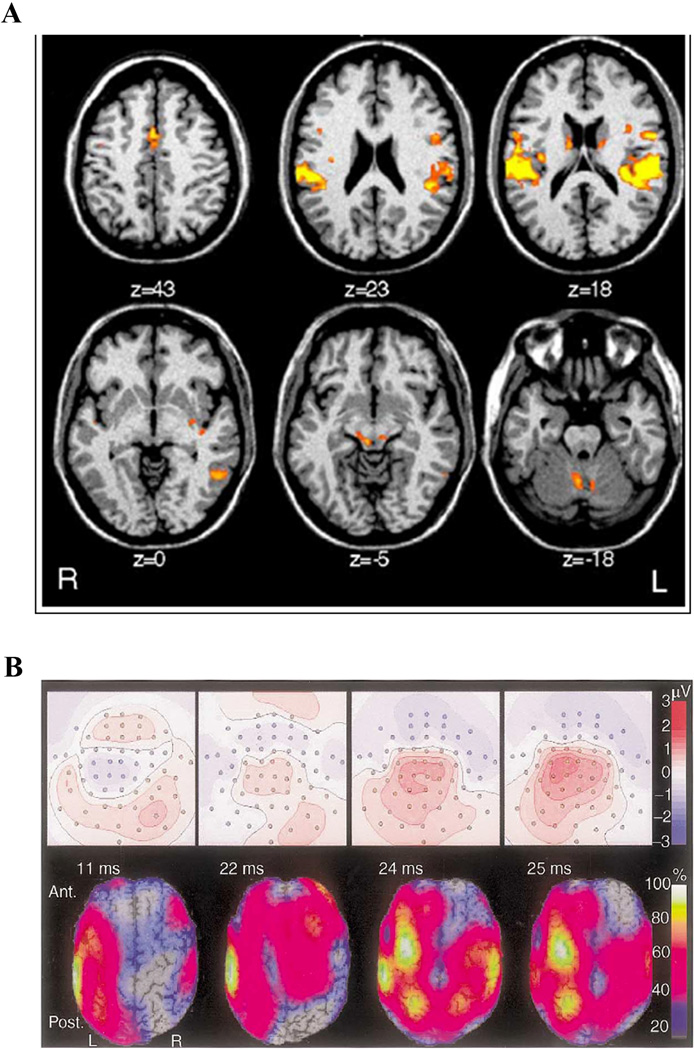
Figure 5. BOLD fMRI and EEG responses to TMS.
(A) Bold fMRI response to rTMS of left dorsal premotor cortex. Six transverse sections showing activity changes in the cingulate gyrus, ventral premotor cortex, auditory cortex, caudate nucleus, left posterior temporal lobe, medial geniculate and cerebellum. (Modified with permission from Bestmann et al, 2005). (B) EEG response to single-pulse stimulation of left sensorimotor cortex. Top panels: Scalp potential with head shown as a two dimensional projection. The contour lines depict constant potentials; positive potentials are red, negative potentials are blue. Bottom panels: Current-density distributions: the calculated current-density at each time point is depicted as a percentage of the maximum current-density at that time point. For this subject, at 11 ms, the activation had spread from below the coil center to involve the surrounding frontal and parietal cortices. Contralateral activation emerged at 22 ms, and peaked at 24 ms. (Modified with permission from Komssi et al, 2002.)

