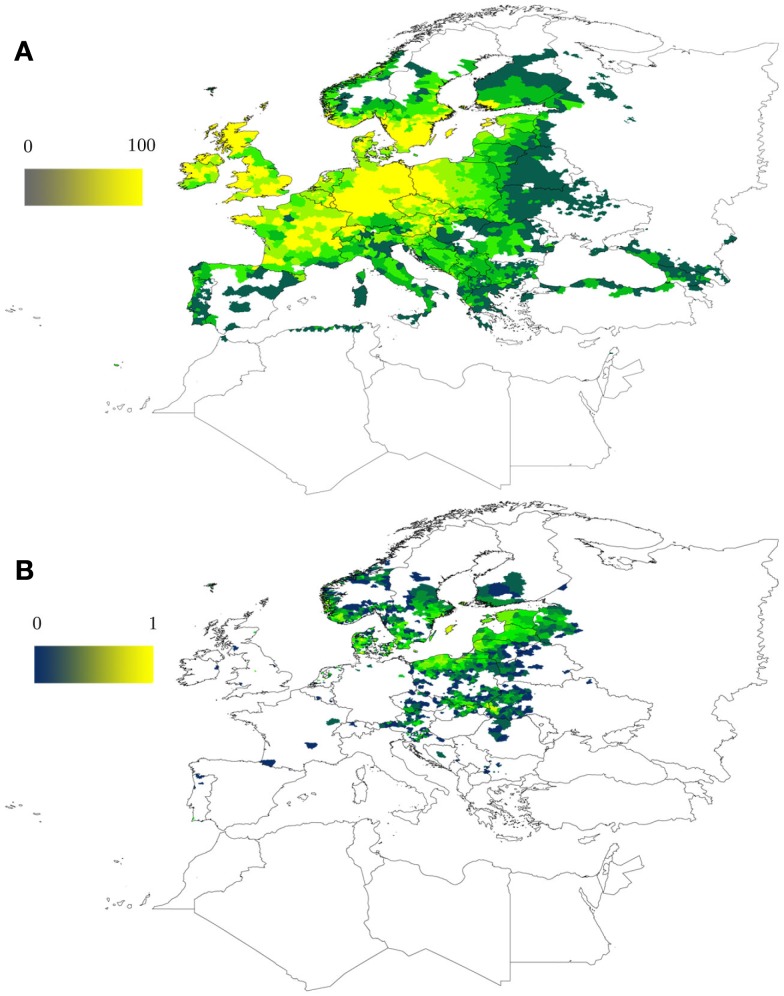
Figure 1.
Predicted climate suitability for the tick I. ricinus in the western Palearctic. (A) Predicted climate suitability (0–100) was evaluated by a model trained with more than 4,000 tick occurrence points using MaxEnt as modeling software (Phillips et al., 2006). The map is based on previous developments by Estrada-Peña et al. (2006). The ramp of colors shows the probability to find permanent tick populations as driven only by climate conditions, including a set of remotely sensed monthly average temperature and vegetation stress (NDVI, a proxy for tick water stress) from 2000 to 2010. (B) Changes in climate suitability for I. ricinus in the period 2000–2010 (from 0, the minimum, to 1, the maximum) based on the same model. Results are based on modeling climate suitability for ticks separately for each year and then evaluating the suitability index trend along years 2000–2010. Both maps (A,B) do not represent tick abundance but the appropriateness of the climate for the development of the tick (A) and how this factor evolved in time (B).

