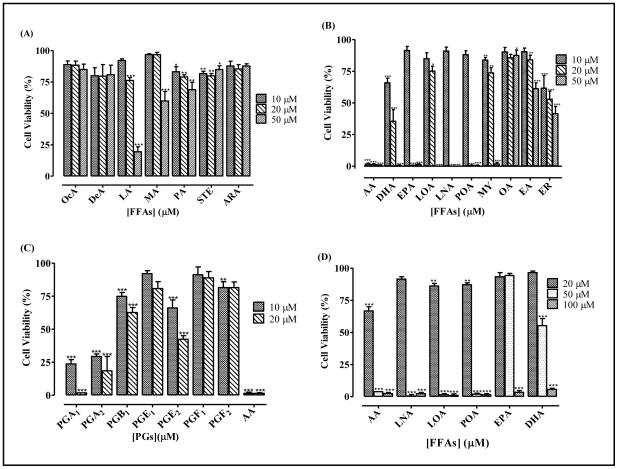
Figure 4. Relative induction of cell degeneration by FFAs and PGs.
Human neuroblastoma cells were cultured and seeded in 96-well plates as described in the methods. The cell viabilities were measured by fluorescence using the resazurin reduction assays after 72 h of treatment with the indicated (A) saturated FFAs, (B) PUFAs and (C) PGs. Cells were also treated with selected PUFAs in the presence of 10% FBS (D). The results are expressed as the means (± SEM, N=4) relative to the controls. *P<0.05, **P<0.01 and ***P<0.001 versus untreated control cells compared by ANOVA, followed by the Dunnett’s post-test.

