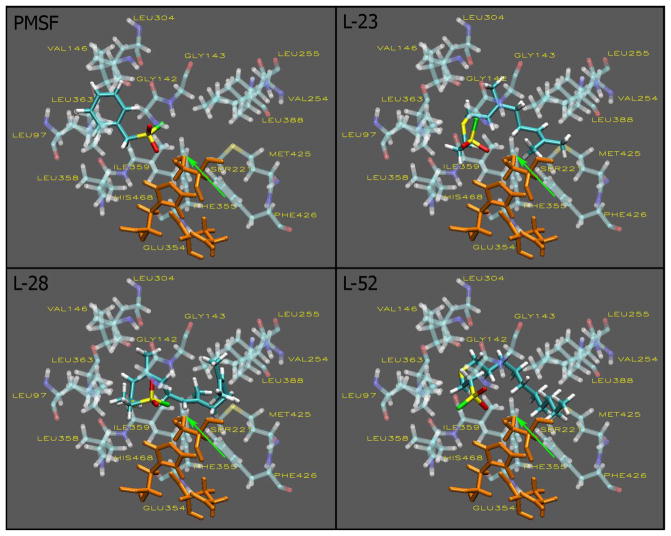
Fig. 3. Sulfonyl fluoride inhibitors in the active site of hCE1.

Docking to the active site of hCE1 was conducted as described in the methods section. The visualizations were created using Visual Molecular Dynamics (VMD). The active site and inhibitors are displayed in the Licorice visualization. The active site amino acids are shown with the coloring method: Name (carbon atoms in blue, oxygen in red, sulfur in yellow, nitrogen in dark blue, fluoride in green, hydrogen in white) and material: Transparent. The sulfonyl fluoride inhibitors are shown with the coloring method: Name and material: Opaque. The catalytic triad is shown in orange and the oxygen atom of ser221 is indicated by the green arrow.
