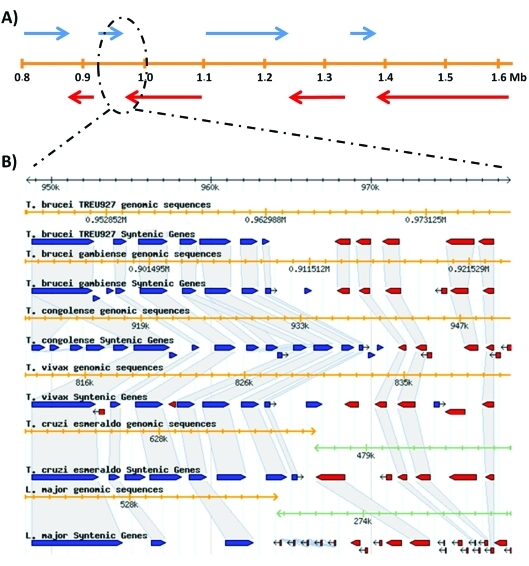
Figure 2.
Gene organization in the Tri-Tryp genome. Panel A shows the gene distribution in a 0.8 Mb region of T. brucei chromosome V with eight large polycistronic transcription units (blue arrows: plus strand encoded open reading frames or ORFs; red arrows: minus strand encoded ORFs). In panel B, a genomic region at around 960 kb is magnified to show the gene synteny in the genomes of various trypanosomatids (blue and red boxes correspond to + and − strand-encoded ORFs, respectively). The orange line in both panels corresponds to the chromosome position. Sequence information used to draw panel A and the graphic representation in panel B were obtained from the Tri-Tryp database (Aslett et al., 2010).

